
Test Status Overview
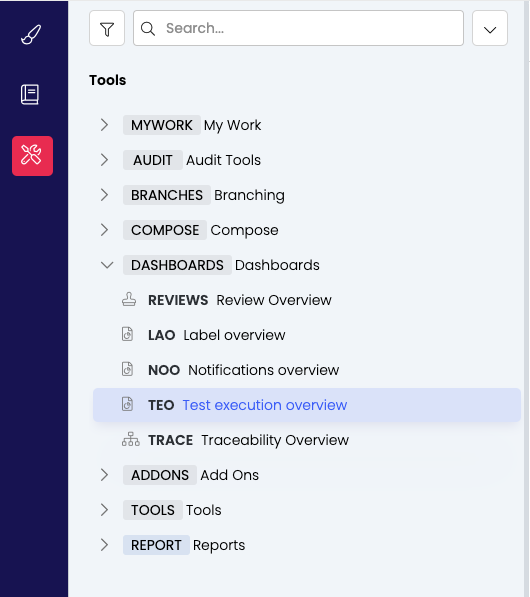
The test status dashboard allows you to review the progress of your tests. You can either launch it through the tools dropdown of an XTC folder or through the TEO Test Execution Overview dashboard in the dashboard folder.
The TEO dashboard allows to select one or different XTC folder(s) and show the test coverage as well as the status of the executed tests. The test coverage will consider all items within the project and see how many are effectively executed in the selected folder.
This can be configured by editing the Test Coverage Dashboard project setting in the Admin panel:
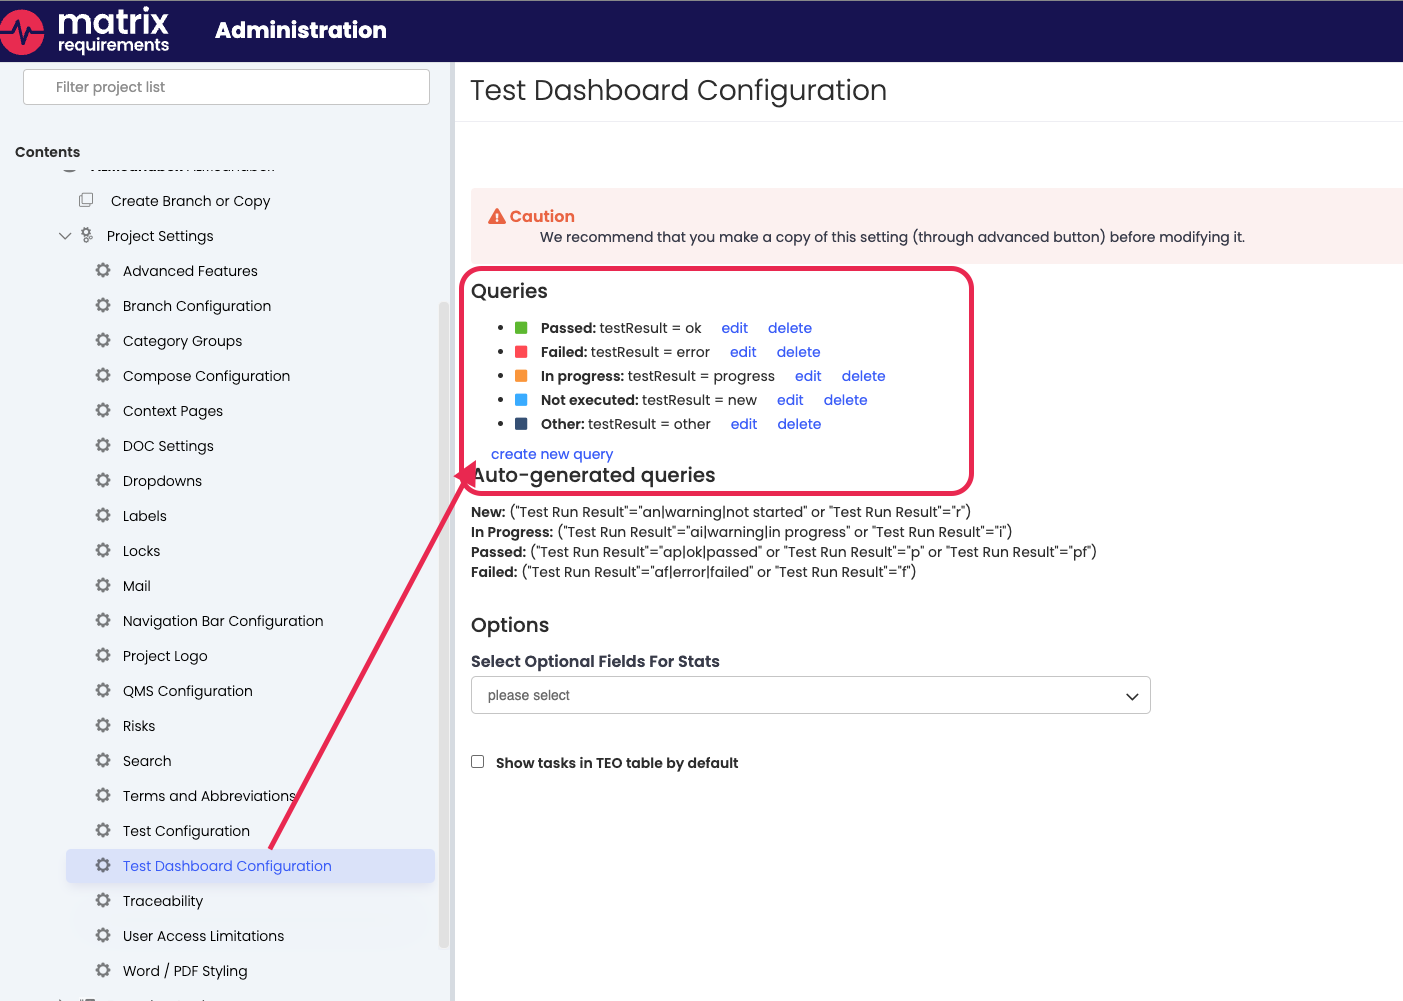
The test status classification and already existing queries can be found in the Test Configuration settings just above the Dashboard Configuration:
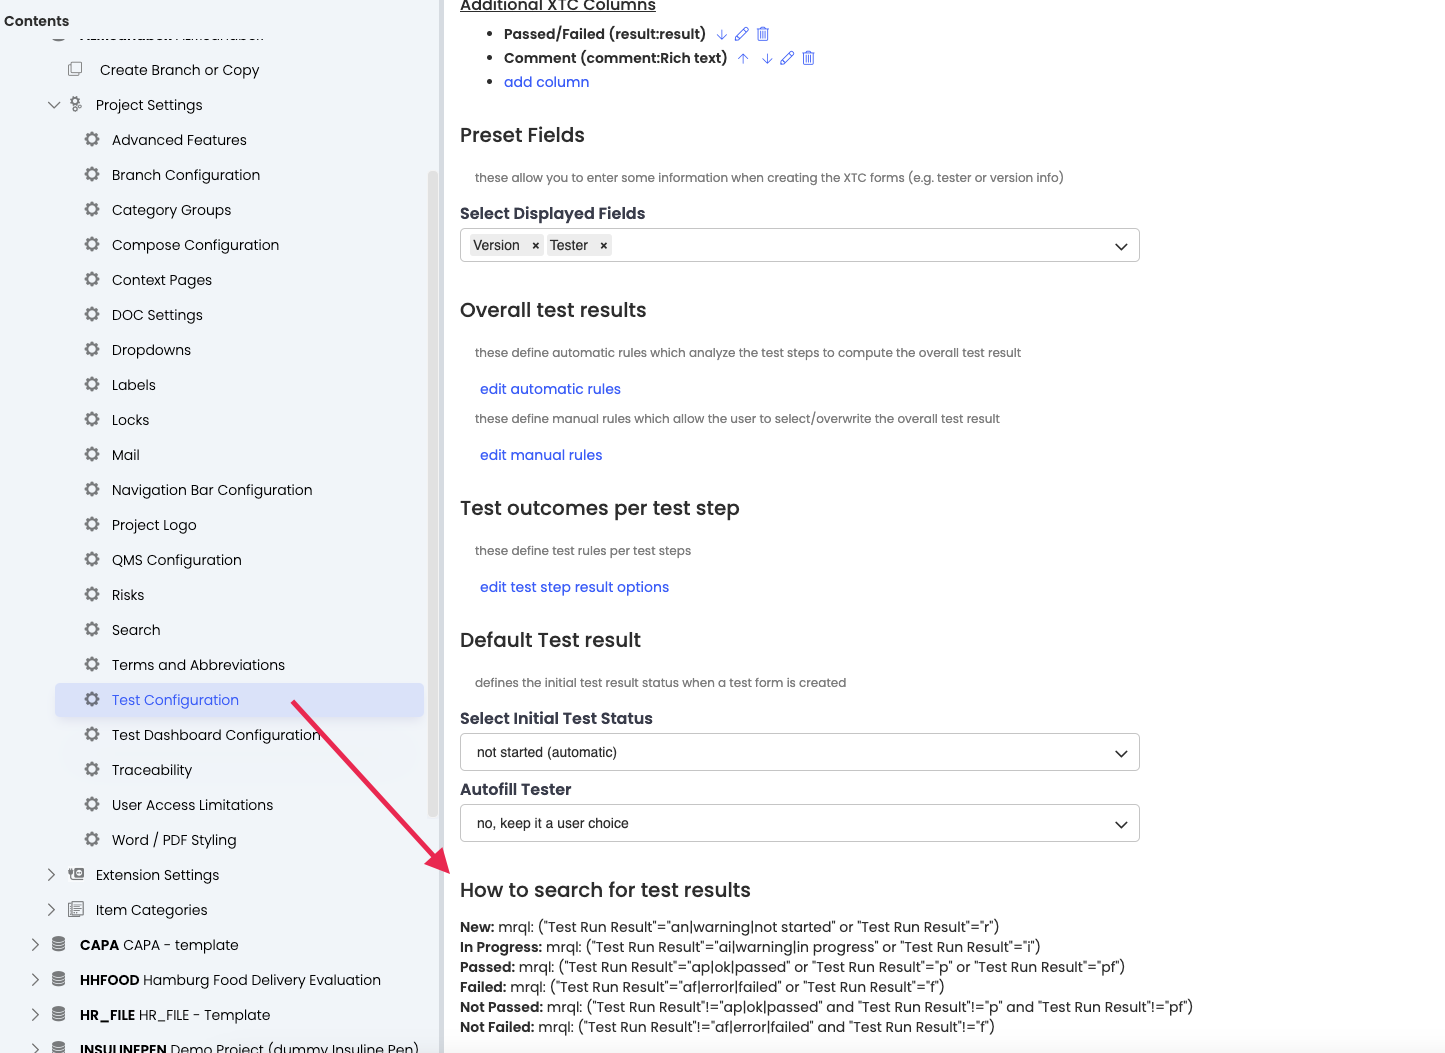
How tests are classified (as passed or failed or whatever) can be edited/ added in the Test Configuration as well.
In the backend each query in the array has
a displayString (the name shown in the UI)
a mrqlPart expression added to the search finding the items
a color used to color the charts
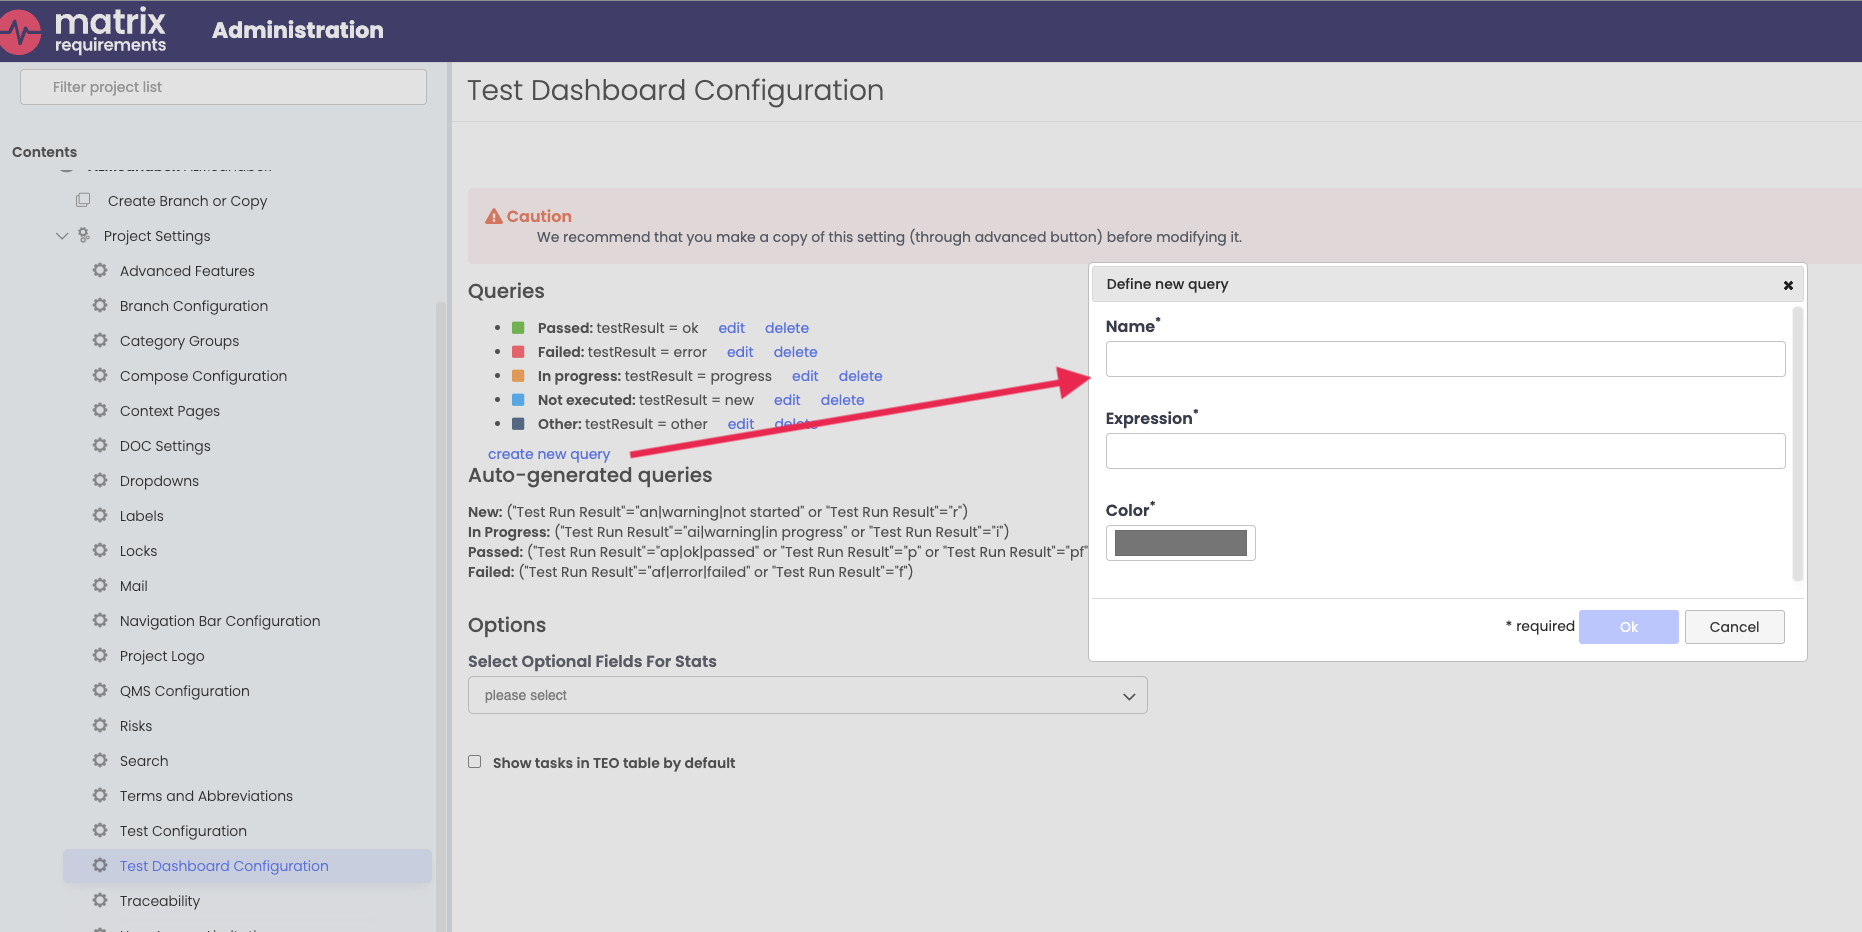
For example to classify the issues in 3 groups instead of the default 5 you could specify:

This can be added and managed through the UI in the Test Dashboard configuration:
If the XTCs are linked to JIRA tickets the links can be shown underneath each XTC item if the following
It is also possible to turn this on globally in the project settings for the TEO dashbaord.

In the same setting it is also possible to select other fields which should analyzed for the dashboard, showing which value was entered how often in the selected tests.