Trace Graph Dashboard - User Instructions
After installation of the plugin the dashboard will be accessible in each project by default. Do find the dashboard and use it, navigate to the TOOLS tab → DASHBOARDS → tgo
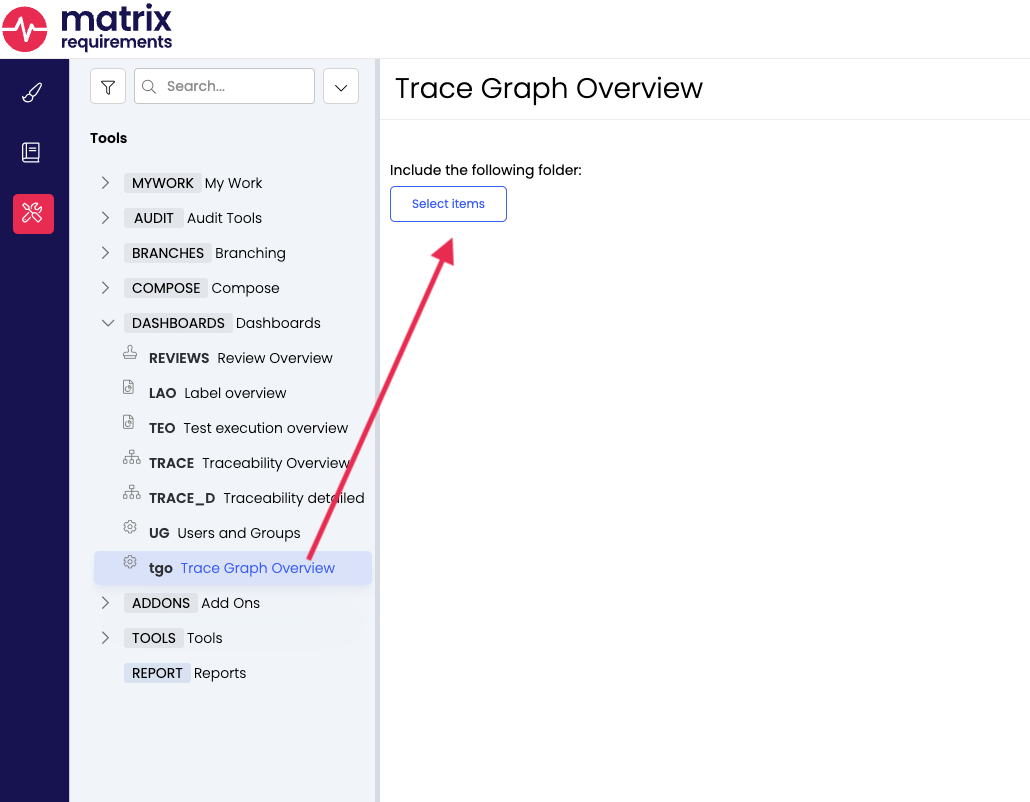
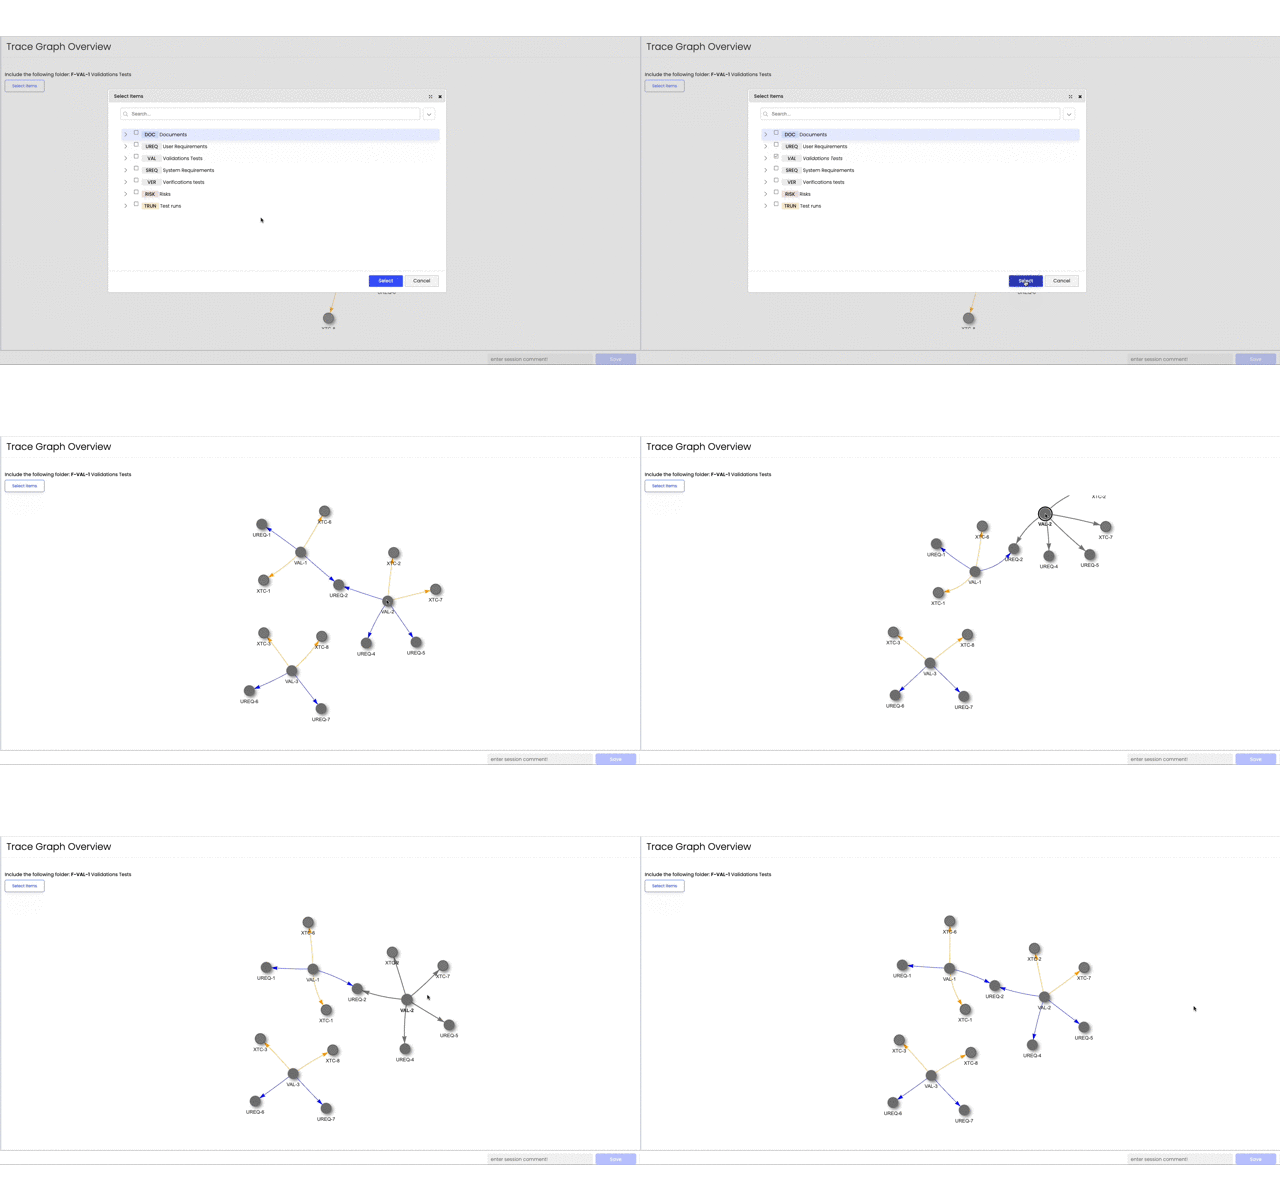
You now get the option to select items in the project for which you would like to highlight the traceability. Please note that the search functionality also supports MRQL to filter for items with custom queries. More info on MRQL can be found here {insert MRQL link}
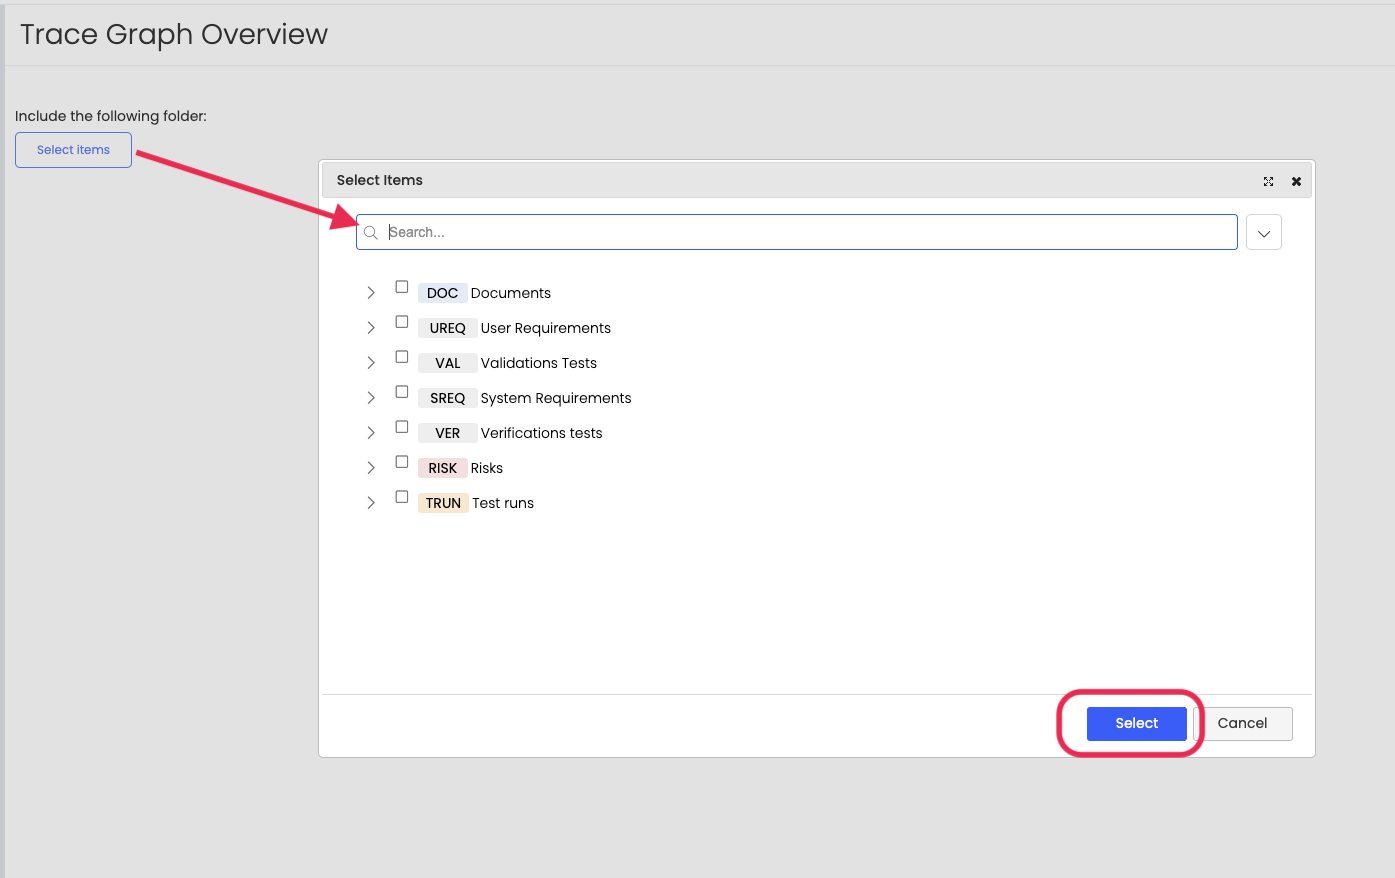
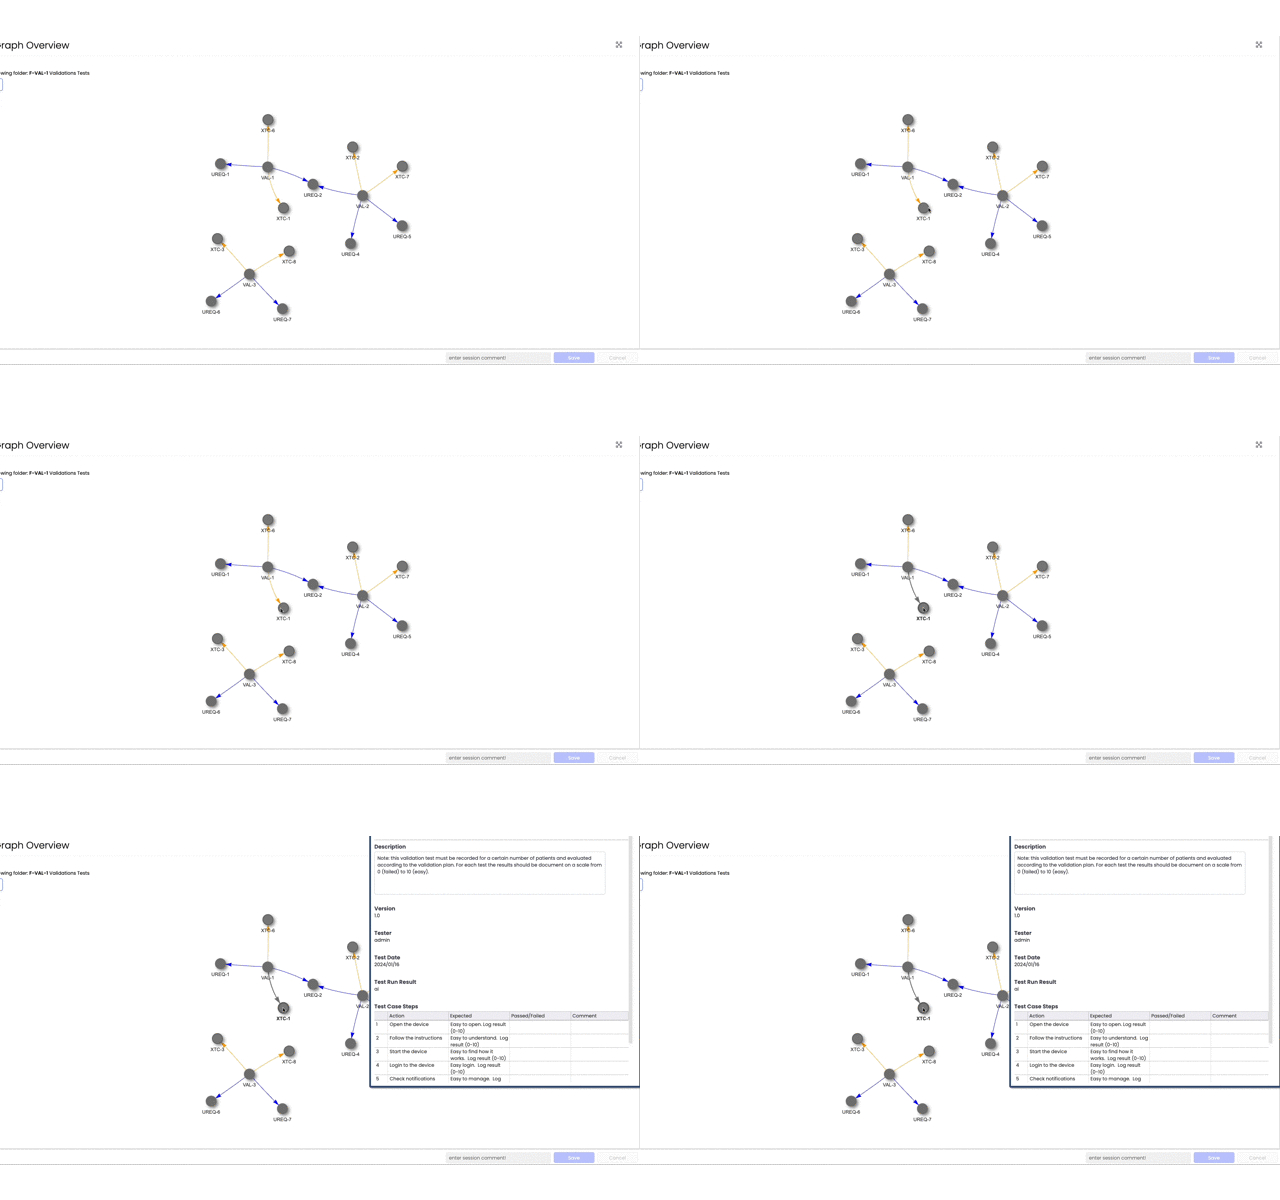
Once the items have been chosen, click on select and a dashboard will be generated based on the traces defined in the project settings of each projects.
Trace definitions will be displayed the same way they are highlighted in the Traceability setup of the project. The traces are visualised on item basis and can be moved if needed, in case they may be positioned inconveniently at first.
Graph legend:
solid black: mandatory down trace
dashed black: optional down trace
solid blue-black: mandatory up trace
dashed blue-black: optional up trace
green: risk mitigation trace (defined in the risk configuration)
orange: XTC trace
Pro Tip:
When holding down the Shift-key while clicking on an item id, you’ll be able to produce an item preview window.
